Start Keeping Track with SharePoint Status Lists

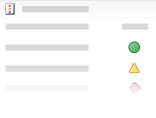
Status lists are a great way to share the status of a task or project with a broader audience. Indicators can be based on data in a database, inside SharePoint, or entered by hand.
Create Scorecards with PerformancePoint Services

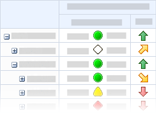
A scorecard is a visual representation of your company's strategy, operational goals and engagement. PerformancePoint Services, a Balanced Scorecard certified product, lets you build robust, interactive scorecards from a variety of data sources.
Analyze and Share with Excel Services
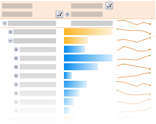
 Share your Excel workbooks with your team through Excel Services. Maintain data connections, interactivity and rich formatting without ever leaving your browser.
Explore Your Data with Visualizations

Publish your highly-formatted charts and reports using Excel Services. For interactive visualizations like the decomposition tree, use PerformancePoint Services.
Add Insight to Information With Dashboards

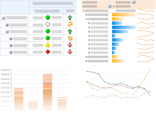
A dashboard is a collection of information that helps you and your team make informed decisions. SharePoint Web Part Pages are a great way to quickly assemble content and create the right views for your team. For rich, interactive dashboards, use PerformancePoint Dashboard Designer to create dashboards that contain a mixture of different content types, including Excel Services reports, PerformancePoint Services scorecards and visualizations, Visio Graphics Services diagrams, and more.